
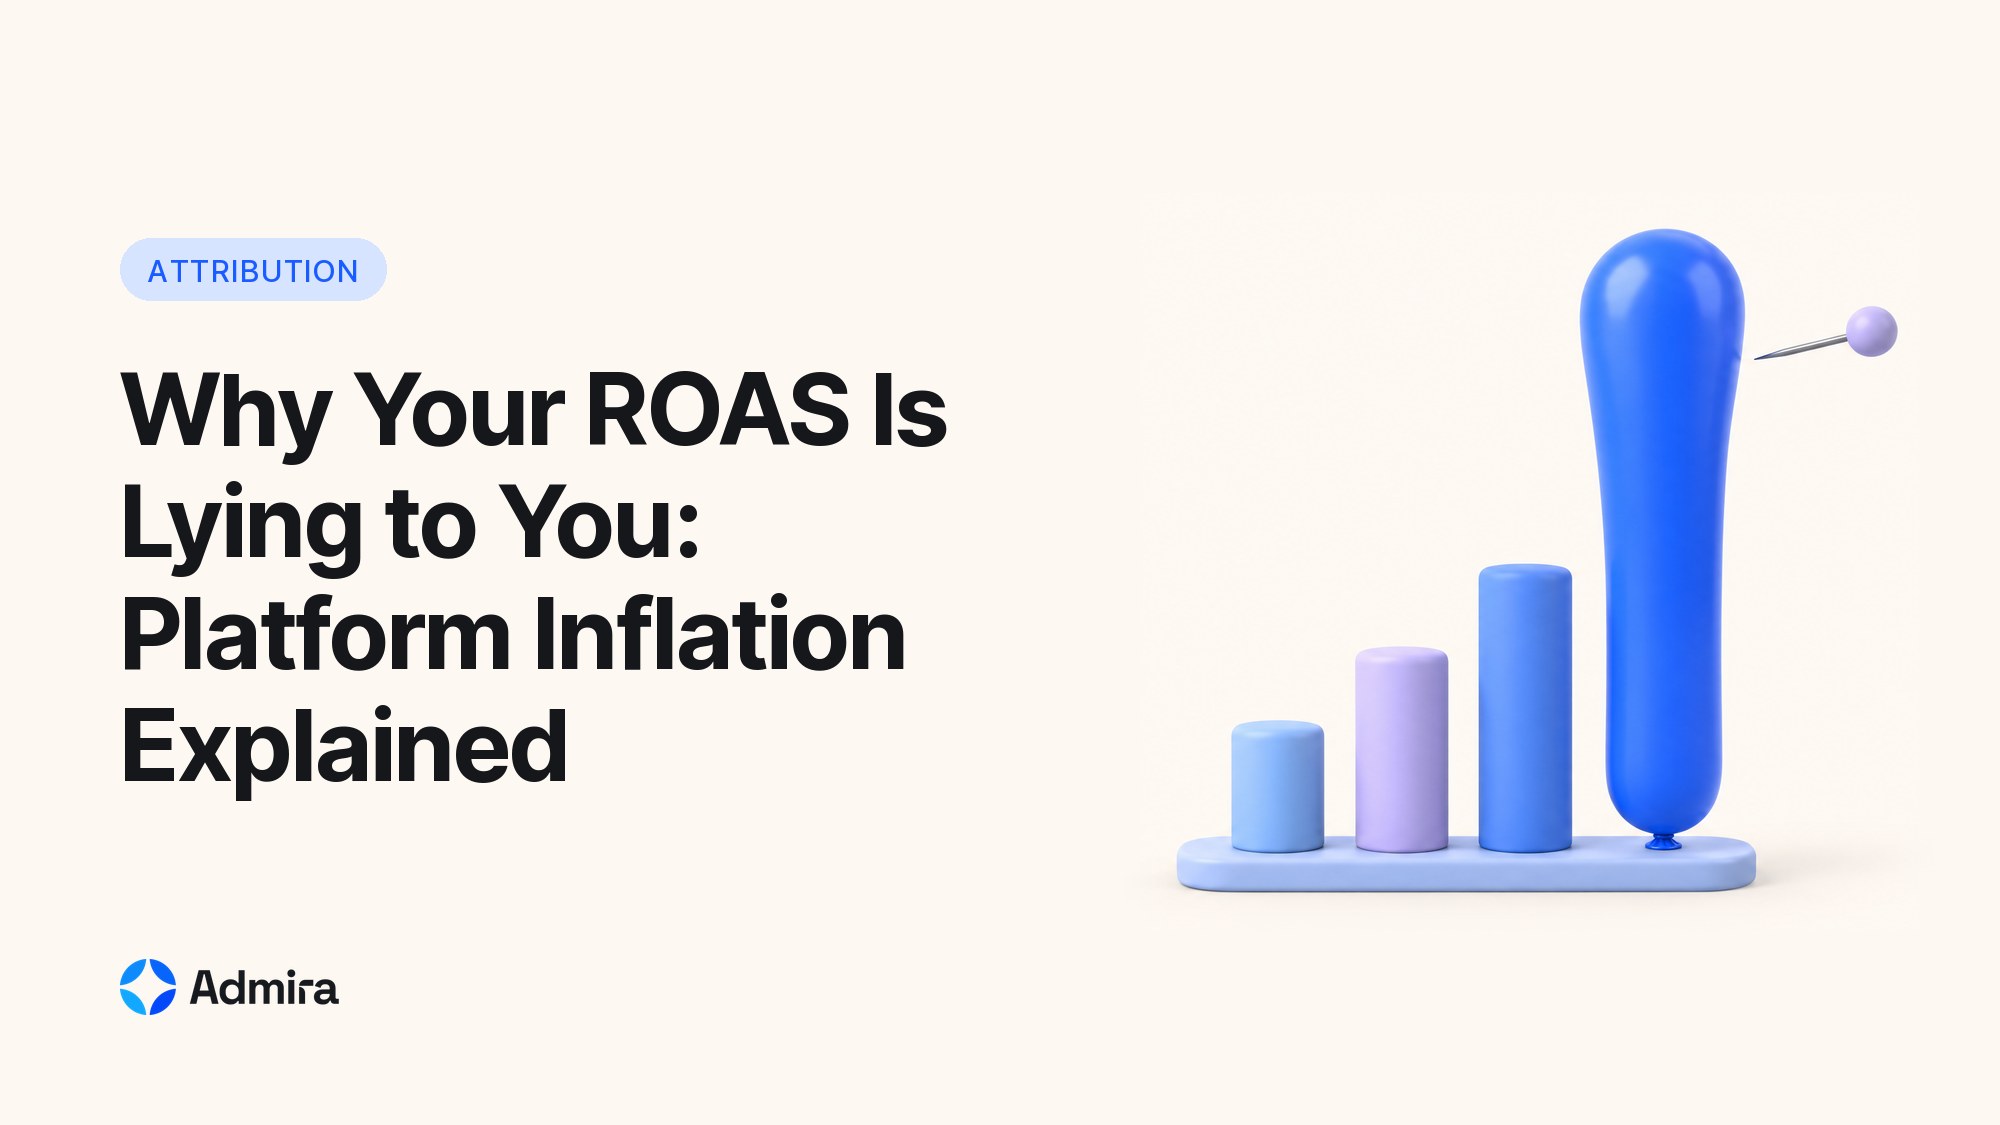
Platform-reported ROAS is inflated because every ad platform grades its own homework. Meta, Google, and TikTok each claim full credit for any conversion they touched, count view-through conversions, and apply generous attribution windows. Add up the conversions each platform reports for the same month and the total routinely exceeds the revenue sitting in your backend. Your real ROAS is almost always lower than the number glowing in the dashboard.
Why platforms over-report conversions
Ad platforms only see their own ads. When a customer clicks a Meta ad on Monday, clicks a Google Shopping ad on Wednesday, and buys on Friday, both platforms report one conversion each. Nothing forces them to share credit, so the same sale gets counted twice, and your blended math quietly breaks. Every platform is optimizing to look as valuable as possible to the person paying for the ads, and their attribution defaults reflect that incentive.
Three mechanics drive most of the inflation:
- Self-attribution. Each platform takes 100% credit for any conversion inside its window, regardless of what other channels did before it.
- View-through conversions. Someone scrolled past your ad, never clicked, and bought later anyway. Meta and TikTok count that as a conversion by default.
- Modeled conversions. Where tracking is blocked by iOS or consent rules, platforms statistically estimate conversions they believe happened. The estimate is directional, not verified revenue.
These three stack on top of each other rather than acting alone. A single retargeting purchase can be self-attributed by Meta, counted again by Google as a click conversion, inflated further by a view-through impression, and topped off with a modeled estimate where tracking was lost. None of the platforms is lying in isolation; each is faithfully reporting what it saw. The distortion comes from adding those overlapping views together and treating the sum as if it were one clean number, which is exactly what a blended ROAS calculation quietly does.
Where the inflation is worst
Retargeting is the classic offender. It reaches people who already visited your site and were likely to buy anyway, then claims their purchases as if the ad caused them. Branded search behaves the same way: someone who typed your brand name was already coming, yet the click gets full credit and the campaign looks unbeatable.
Prospecting campaigns on paid social usually show the opposite problem. They create the demand that branded search and retargeting later harvest, but under platform reporting they look expensive because the final touch happened elsewhere. The inflation is not evenly spread, which is exactly why summing platform ROAS to judge your whole account is so misleading.
How to check your own inflation in 15 minutes
- Pick a clean 30-day period without major promotions or tracking changes.
- Export purchase conversions and conversion value from every ad platform you run.
- Sum them, then pull actual orders and revenue from your store backend or CRM for the same window.
- Divide platform-claimed revenue by backend revenue. A ratio meaningfully above 1.0 is double counting plus view-through and modeling; ratios well above that are common for retargeting-heavy accounts.
The number you get is your personal inflation factor, and watching it over time is more useful than any industry benchmark. If it holds steady, your platform ROAS is biased but predictable. If it lurches around, your reporting is unstable and any decision based on a single month's ROAS is built on sand.
Platform ROAS vs independent measurement
| Platform ROAS | Independent measurement | |
|---|---|---|
| Who assigns credit | The platform selling you the ads | A neutral system seeing all channels |
| Cross-channel deduplication | None | One conversion counted once |
| View-through handling | Counted by default | Weighted or tested, not assumed |
| Answers "what if I cut budget?" | No | Yes, via MMM and lift tests |
What to use instead of platform ROAS
Start with MER, total revenue divided by total ad spend. It is crude, but it cannot be gamed by attribution because it never asks which channel deserves credit. MER tells you whether the whole system is healthy, and it is the fastest sanity check against a dashboard that looks too good. If your platforms claim a 4x blended ROAS but your MER says you are barely breaking even, the platforms are wrong and the MER is right.
Then layer real measurement on top: multi-touch attribution to deduplicate credit across channels, marketing mix modeling to see channel contribution without cookies, and incrementality tests to prove causation on your biggest line items. Tools like Triple Whale and Northbeam do pixel-based attribution well for ecommerce, and Ruler and Dreamdata serve lead-gen and B2B pipelines. The gap most teams hit is that attribution alone still cannot tell you what would have happened without the ad, which is why combining attribution with MMM and lift testing matters more than picking one vendor.
Admira exists for exactly this problem: it combines multi-touch attribution, marketing mix modeling, and lift testing in one cookieless-first platform, so you can see deduplicated performance across every channel instead of five inflated dashboards. If your reported ROAS looks too good to match the money in the bank, book a demo and put a real number next to the inflated one.
FAQ
Is platform ROAS completely useless?
No. It is genuinely useful for comparing ads, creatives, and audiences inside one platform, where the bias is roughly constant and cancels out. It fails when you use it to compare across platforms, whose biases differ, or to decide your total budget, where the inflation has no counterweight. Use it as a tactical in-platform signal, not as a cross-channel or account-level truth.
Which platform inflates the most?
It depends on your mix rather than any fixed ranking. View-through-heavy social retargeting tends to over-claim the most, because it counts impressions no one acted on, while search on generic non-branded terms is usually closer to reality. The only reliable answer is to audit your own inflation ratio per platform instead of trusting a universal rule that will not match your account.
Should I just turn off view-through attribution?
Tightening windows to 1-day view or click-only makes your reports more conservative and closer to backend revenue, which is often worth doing for decision-making. But it also changes what the optimization algorithm learns from and chases, so it is not free. Test the change and watch real orders rather than assuming stricter reporting automatically means better buying.
Is MER enough on its own?
No. MER tells you whether the whole system is healthy, not which channel to scale or cut, because it deliberately ignores attribution. Use it as the guardrail that catches a dashboard drifting away from reality, while multi-touch attribution, MMM, and lift tests answer the allocation questions MER cannot. Together they give you both a sanity check and a decision framework.




.svg)
%20(2).png)