Oops! Something went wrong while submitting the form.


Ready to try Admira?
Meet with a product expert
A marketing dashboard with revenue by channel, not a pile of tabs
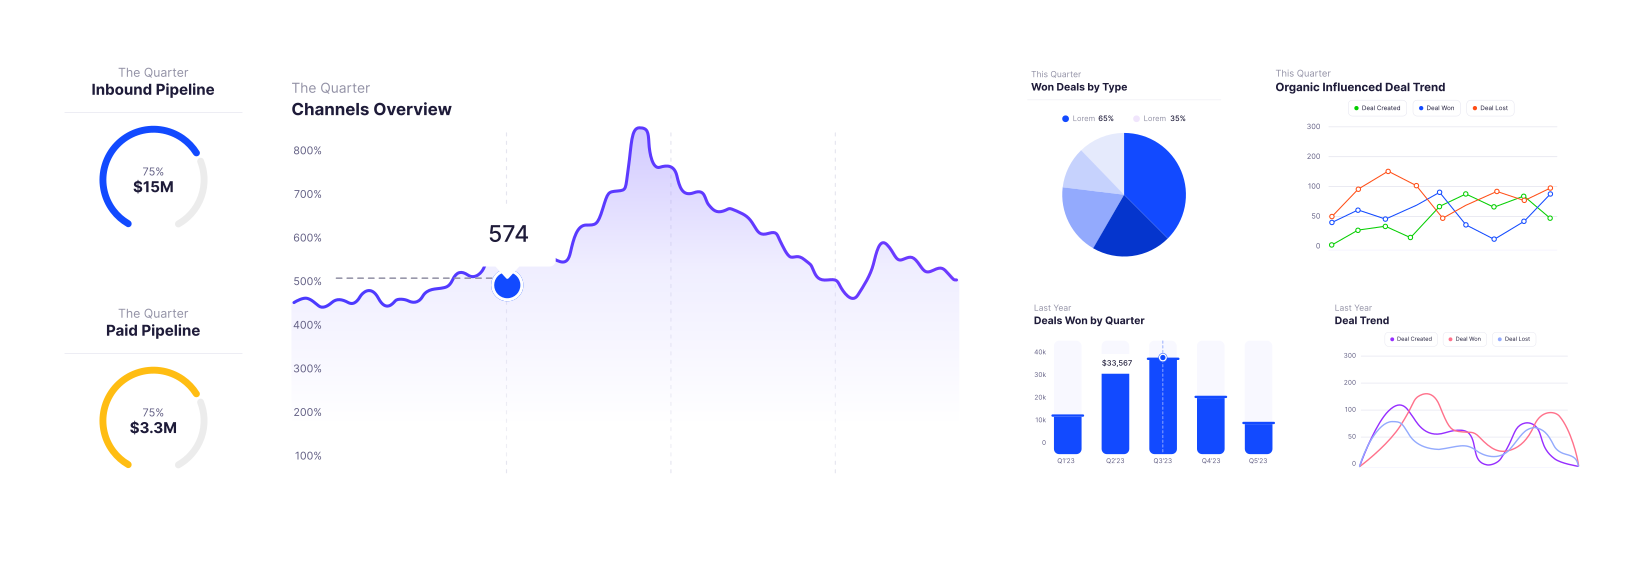
Stop building Monday's report by hand. Admira puts spend, leads, deals and revenue by channel, campaign and ad in one marketing dashboard that updates itself and you can share.







AI Analyst
Ask your dashboard
Ask in plain language which channel brought the most revenue this month or why CAC went up. Admira's AI analyst answers in seconds, with no SQL and no Excel.
Book a demo
Connect your sources
Ads, website and CRM
Meta, Google, TikTok and LinkedIn ads, your website and your CRM sync into one dashboard. No more copy-pasting exports.
Book a demo
Numbers that match
Platform data meets CRM
Each lead is followed from first click to closed deal in your CRM, so ad numbers and sales numbers finally tell one story.
Book a demo
Shared reports
Same numbers for everyone
Share reports with your team or leadership, and get updates in Slack instead of another spreadsheet.
Book a demo
Plug in every tool your report depends on
Ad platforms, Click-to-WhatsApp, your website and CRMs like HubSpot, Salesforce, Kommo, Pipedrive and Zoho.








Your marketing dashboard, by channel and campaign
Ready-made views show spend, leads, deals, revenue, CAC and ROAS by channel, campaign and ad. Customize any column.
Funnel at a glance
From impressions to leads to qualified leads, in one view.


Ideal customers
See which channels bring the customers who engage most.


Leads over time
Spot spikes and drops in leads by month and by channel.


Spend vs. revenue
Ad spend, revenue and blended ROAS side by side, always current.


Every touchpoint
Follow each sale back to the ad click that started it.


Revenue by period
Compare revenue month over month, by channel.

Campaign, ad set, ad
Break down conversions by ad account, campaign and ad set.


One source of truth for every Monday meeting
Built to stay up
Built for teams that report every week: 99.9% uptime, so your dashboard is always there.
Privacy and security
GDPR and CCPA compliant. Cookieless tracking by default, cookie-based if you choose.
Live in minutes
No engineering needed. Connect your ad platforms and CRM in minutes and import historical data to compare past months.
Marketing dashboard questions
How long does setup take?
Technical setup takes minutes. Full onboarding, including dashboard setup and team training, takes about two weeks. You can import historical data to start with context.
Can I customize the dashboard?
Yes. Every dashboard is fully customizable, from columns to metrics, so it matches the report your team already reviews.
Why do my numbers never match?
Each ad platform counts conversions its own way and doesn't see the deals closed in your CRM. Admira ties spend to the leads and deals in your CRM, so revenue by channel adds up.
Does it cover Facebook and Google Ads?
Yes. Meta (Facebook), Google, TikTok and LinkedIn ads sit in one place. Share reports with your team or leadership and send updates to Slack.
Is my CRM supported?
Admira connects to HubSpot, Salesforce, Kommo, Pipedrive, Clientify, Zoho and more. If a tool you use isn't supported, we build the integration.
Is my data safe and private?
Your data is stored securely on AWS in Austin, in the US. Admira is GDPR and CCPA compliant and does not collect personal data by default.